Building the Hydrological Time Series
Before we can train forecasting models, we need a clean, regular, and sufficiently long time series that captures the dynamics of the system under study. In our case, we are interested in the mean daily discharge of the Mississippi River at the city of St. Louis, Missouri.
The goal of this first step is therefore to build a usable hydrological dataset for one-day ahead forecasting experiments. In other words, we want to be able to forecast tomorrow's river discharge based on past observations.
To do this, we will rely on the services of the USGS (United States Geological Survey), which provides a vast amount of public hydrological data through several freely accessible APIs.
Note
This first section is closer to data mining than to actual modeling. The same will be true for other sections later in this tutorial. It should be noted that, in the field we are studying, data mining usually accounts for a very large portion of the work involved!
Scripts used in this section
stations_map.pystation_download_daily.py
The USGS Water Data API
The data used in this study come from the following portal:
https://api.waterdata.usgs.gov/
This platform provides access to a wide range of environmental observations measured across the United States, from streamflow and groundwater levels to reservoir levels, water quality measurements, and many other hydrological variables.
The USGS also provides a Python library called dataretrieval, which greatly simplifies querying these services from a script. Several other libraries, such as geopandas or folium, will be used in this workflow to manipulate geographic data and generate map visualizations.
Among other things, these tools will allow us to visually select a relevant hydrological station before downloading the actual data.
Exploring Hydrological Stations
Before retrieving a time series, we must first select an appropriate station.
To do this, we developed the script:
stations_map.py
This script automatically builds an interactive map of USGS hydrological stations located within a geographic area chosen by the user. The study area is defined using a bounding box, i.e., a geographic rectangle described by minimum and maximum latitude and longitude coordinates.
The script then queries the USGS API using the dataretrieval library to retrieve the stations located within this spatial extent.
The query uses the following parameter:
site_type_code="ST"
In the USGS nomenclature, the code "ST" stands for surface-water stations, i.e., stations associated with surface water: rivers, streams, creeks, and surface hydrological systems.
Therefore, the script does not retrieve just any type of environmental station; it is explicitly limited to surface hydrological stations.
The coordinates returned by the API are then converted into geographic objects using GeoPandas and Shapely, which allows for proper manipulation in a cartographic context. The final visualization is generated with Folium, which itself relies on Leaflet to produce an interactive HTML map that can be directly used in a web browser.
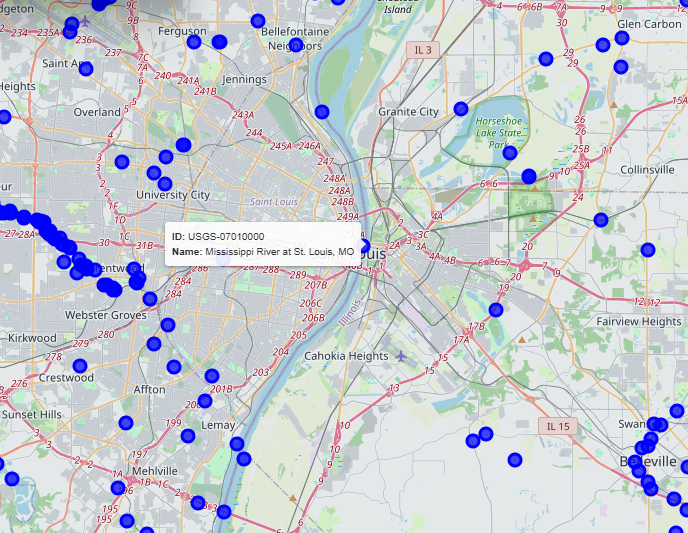
Figure 2 — UGCS stations around Saint-Louis
Each station appears as an interactive marker displaying its USGS identifier and name.
The study area is also outlined by a slightly colored rectangle to make the geographic extent used in the query immediately visible.
The script does not simply display points on a map; it also dynamically adjusts the navigation constraints to the study area. The user cannot pan the map outside the defined bounding box, and the minimum zoom level is automatically calculated based on the size of the selected region. This prevents excessive zooming out while still allowing the stations to be explored in greater detail.
The final result is exported as a self-contained HTML file that automatically opens in the browser.
Thanks to this visual exploration, we identified a particularly interesting station located directly on the Mississippi River at St. Louis:
Mississippi River at St. Louis, MO
USGS-07010000
This station will serve as the foundation for all the forecasting experiments presented in the remainder of this study. It will serve as what is known as the reference series.
Downloading Hydrological Data
The actual download is performed using the script:
station_download_daily.py
"dv" (daily values) service to retrieve daily observations for the selected station.
Two variables are initially downloaded:
- river discharge (streamflow);
- gage height.
The study period covers sixteen full years:
2010-01-01 → 2026-04-30
The script does not simply download raw data. Several validation and normalization steps are performed automatically to produce a time series that is usable for machine learning.
Timestamps are first cleaned to avoid issues related to time zones or date shifts. A strict daily time grid is then reconstructed using pandas.date_range(). This step ensures that each day within the study period appears exactly once in the final time series.
The script also performs a systematic analysis of missing values and any potential temporal gaps.
In practice, the results turned out to be very different depending on the variables studied. The Mississippi discharge (discharge_cfs) proved to be particularly clean: no missing values were detected over the entire study period. The gage height (gage_height_ft), on the other hand, contained numerous gaps, sometimes several days long.
To maintain a perfectly regular time series for this initial study, only the discharge variable was ultimately retained.
The final dataset is exported to:
07010000_daily_data.json
The file includes all the information required to work with the dataset, namely the station metadata, the temporal bounds, the list of variables, and the complete time series.
We thus have a daily hydrological time series of 5,844 observations with no missing values, ready to be used for forecasting experiments.
The following sections will use this time series to compare several approaches for one-day ahead discharge forecasting.